How to build and use Chrome extensions for WebSocket debugging

This article discusses how you can use Chrome extensions in conjunction with the debugger to intercept and decode WebSocket traffic. Using a practical example named "Deriv WebSocket Trace,” it will walk you through quickly setting up a Chrome extension for WebSocket debugging.
Mastering Chrome tools to debug WebSocket connections
Chrome provides a fully-fledged debugger. Pretty much anything you can do in the inspect/debug window you can do with the debugger object. However, it's not available on any standard web page to prevent potential misuse. Nevertheless, you can tap into this powerful feature via Chrome extensions.
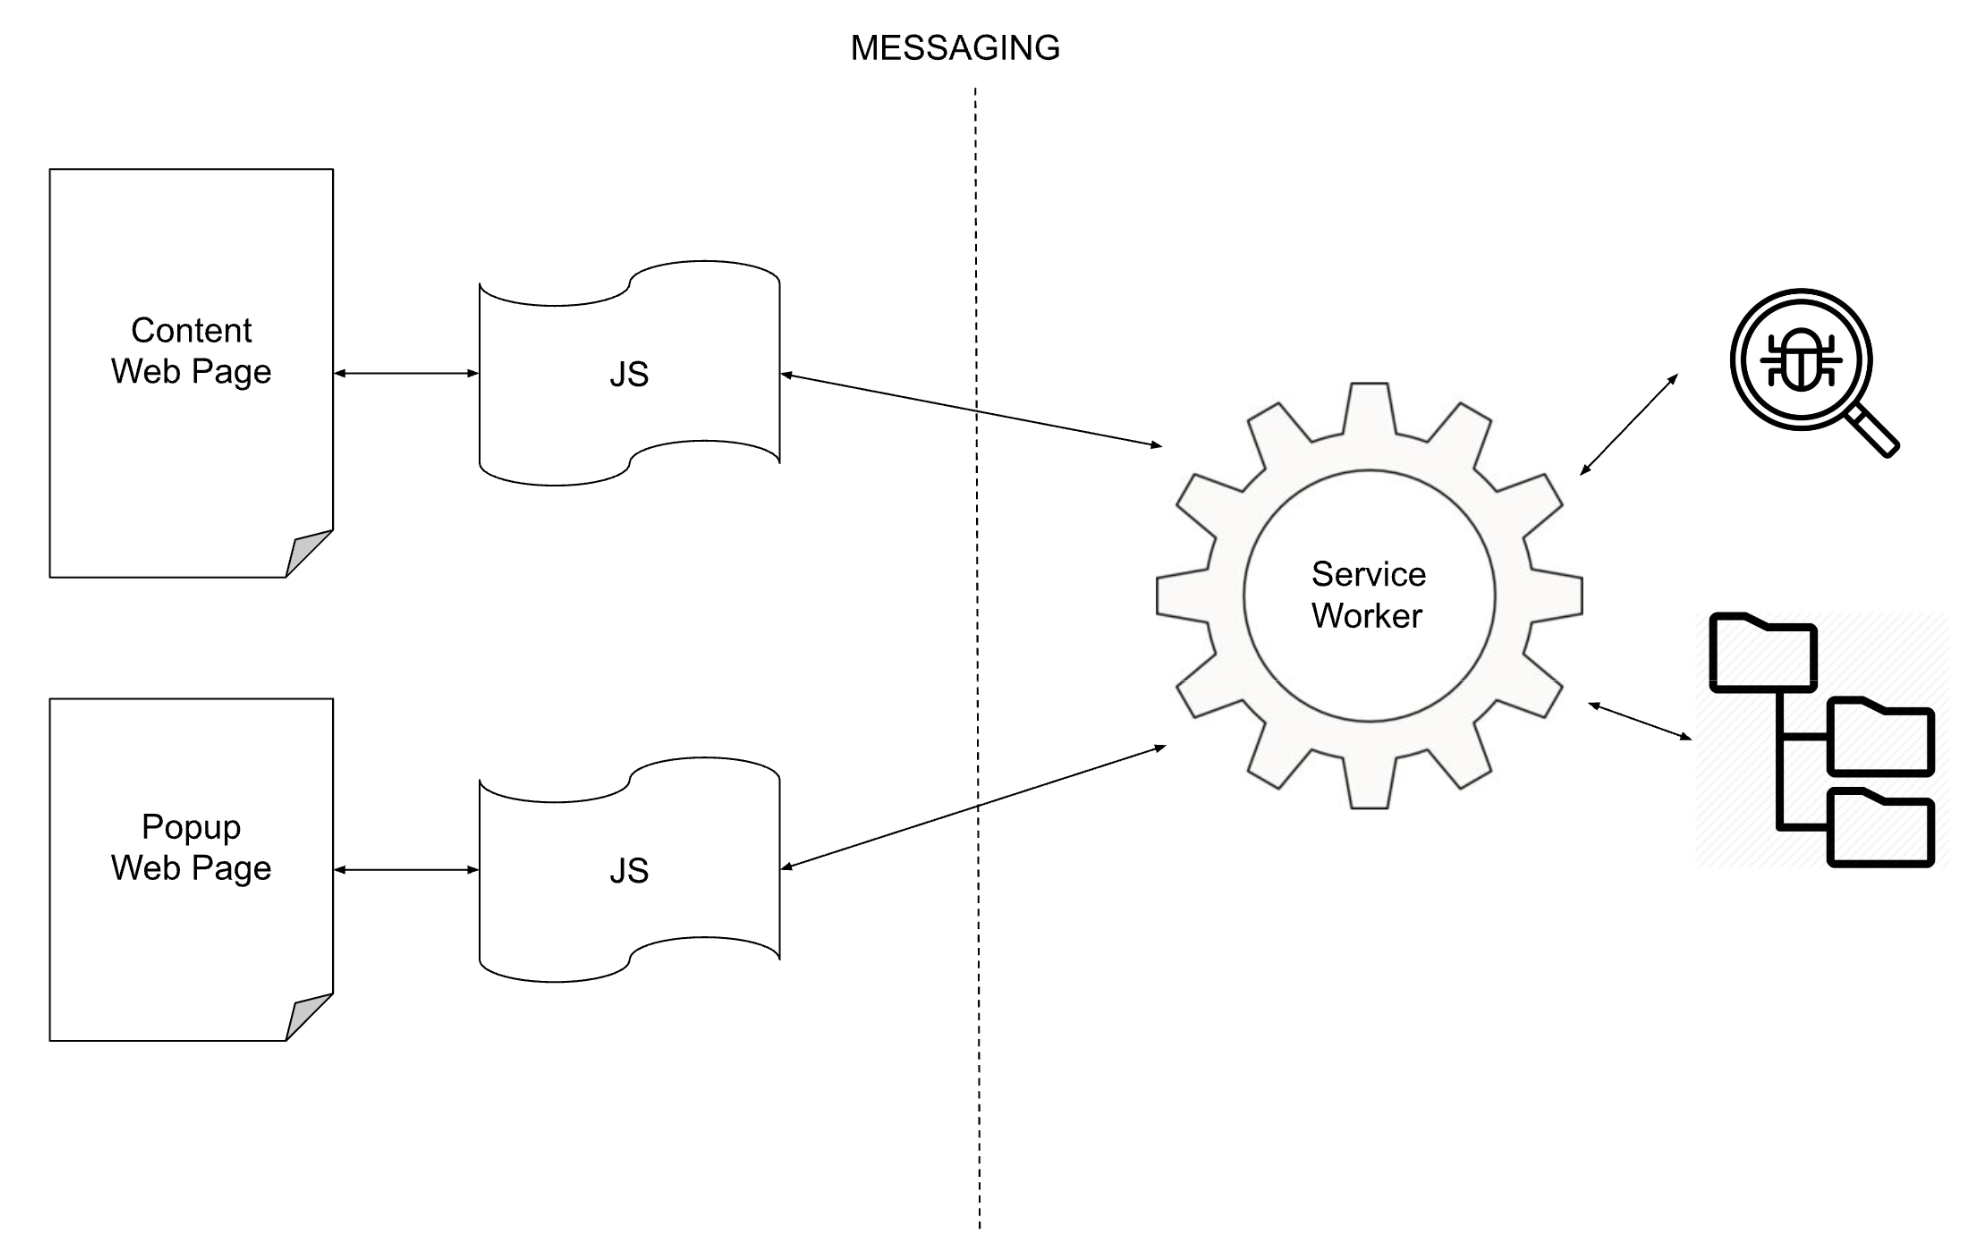
The debugger is limited to being accessed within a sandboxed background "service worker," and any data collected must be transferred to the foreground content windows. Since service workers lack document object model (DOM) access, all data for rendering must be communicated to the foreground via messaging.
When you build the manifest.json for your extension then, it's important to declare your intention to use the debugger. This enables Chrome to inform the user about your extension's capabilities and the objects it will have access to.
{
 "manifest_version": 3,
 "name": "Deriv WebSocket Trace",
 "icons": {
   "128": "images/wss_trace_128.png"
 },
 "description": "Look at command/response times on websocket connections",
 "version": "0.04",
 "host_permissions": ["*://*.deriv.com/*"],
 "permissions": ["debugger", "webRequest", "activeTab", "storage"],
 "content_scripts": [
   {
     "matches": ["*://*.deriv.com/*"],
     "js": ["scripts/content.js", "scripts/trace.js"]
   }
 ],
 "background": {
   "service_worker": "scripts/service-worker.js"
 },
 "action": {
   "default_popup": "html/content_popup.html",
   "default_icon": "images/wss_trace_128.png"
 },
 "options_ui": {
   "page": "html/options.html",
   "open_in_tab": false,
   "browser_style": true
 }
}
An example of building manifest.json for WebSocket debugging extension
It's important to remember that there is only one global debugger instance. To examine data from a specific tab or window, the debugger must first be attached to that tab or window.
Accessing and utilising the WebSocket debug tool
Within your service worker, you'll need to decide when and to which windows to attach debuggers. One approach is to monitor changes to tabs, such as loading or completion events, using `chrome.tabs.onUpdated.addListener`. There are several other event types, indicated by `on…`, to which listeners can be attached to. Based on specific criteria, you can then choose when to attach a debugger to a tab. It's also advisable to add listeners to `onRemoved` for cleanup purposes.
Strictly speaking, it's not necessary to monitor which tabs you're attached to, as it's not possible to attach more than one debugger to a tab. You can verify this in the callback by checking if `chrome.runtime.lastError` is set, which typically indicates the debugger is already attached to the tab. However, it's considered good practice to keep track of tabs with attached debuggers and to remove listeners once no debugger connections are in use. This approach offers several advantages that we shall discuss later.
let debuggerAttached = {};


chrome.tabs.onUpdated.addListener((tabId, changeInfo, tab) => {
 if (changeInfo.status == 'loading') {
   if (tab.url && new URL(tab.url).hostname.endsWith('deriv.com')) {
     console.log('Detected deriv.com tab loading',tabId,changeInfo);
     if (!debuggerAttached[tabId]) {
       chrome.debugger.attach({tabId}, '1.0', () => {
         if(chrome.runtime.lastError) {
           // Debugger is likely already attached
           console.log('Debugger likely already attached:',
             chrome.runtime.lastError.message);
         } else {
           console.log(`Debugger attached to tabId:${tabId}`);
           chrome.debugger.sendCommand({tabId}, 'Network.enable');


           // We only want to attach the event listener once
           // when the first debugger is attached
           if (Object.keys(debuggerAttached).length === 0) {
             console.log(`Attaching debugger event listener`);
             chrome.debugger.onEvent.addListener(handleDebuggerEvent);
           }
           // Signal that the debugger is attached
           debuggerAttached[tabId] = tabId;
         }
       });
     } else {
       console.log(`Debugger already attached to tabId:${tabId}`);
     }


   }
 }
});
An example of Chrome extensions in manifest.json file
Once you've attached the debugger to ANY tab, a warning banner will appear on all tabs to ensure the user is aware of the extension's actions, which might be considered intrusive. If the user clicks the cancel button, it will force the detachment of the debugger from all tabs to which it's attached.
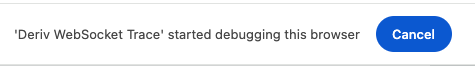
You can also monitor when the debugger is detached, either due to user cancellation or the tab being closed, and use this event for cleanup. There's no need to attach or detach listeners beyond the purpose of avoiding the constant appearance of the warning banner. Importantly, this banner cannot be closed without interrupting the debugger connection.
chrome.debugger.onDetach.addListener((source, reason) => {
 if (source.tabId && debuggerAttached[source.tabId]) {
   console.log(`Debugger detached from tabId:${source.tabId} due to ${reason}`);
   delete debuggerAttached[source.tabId];
   if (Object.keys(debuggerAttached).length === 0) {
     // All attached debuggers have been removed, so remove the listener
     console.log(`Debugger listener removed from tabId:${source.tabId}`);
     chrome.debugger.onEvent.removeListener(handleDebuggerEvent);
   }
 }
});
An example of debugging in json file.
It's crucial not to attach more than one listener to the debugger unless you intend to use multiple listener callbacks. Early attempts at attaching a listener every time a debugger was attached to a tab led to chaos, with multiple duplicate messages being received — one for each added listener because the debugger functions as a global object.
Now that you have a debugger attached and a listener set up to receive events, you can explore a list of messages here to find the ones relevant to your needs. For my purposes, there were four that were of interest:
function handleDebuggerEvent(debuggeeId, message, params) {
 {
   switch (message) {
     case 'Network.webSocketCreated':
       traceSocketCreate(debuggeeId, params);
       break;
     case 'Network.webSocketClosed':
       traceSocketClose(debuggeeId, params);
       break;
     case 'Network.webSocketFrameSent':
       traceSocketSend(debuggeeId, params);
       break;
     case 'Network.webSocketFrameReceived':
       traceSocketReceive(debuggeeId, params);
       break;
     default:
   }
 }
}
An example of events captured by the debugger.
The debuggeeId is an object that should include the `tabId` of the tab from which the WebSocket data originated. The `params` object within it will contain relevant information, particularly of interest to your specific needs:
FrameSent/FrameReceived
- requestId — The unique identifier for the WebSocket connection
- response — The payload of the send/receive
Created
- requestId — The unique identifier for the WebSocket connection
- url — The destination endpoint for the WebSocket
Closed
- requestId — The unique identifier for the WebSocket connection
So the combination of `tabId` + `requestId` enables unique tracking of data coming from any particular WebSocket in any desired tab, facilitating precise monitoring and analysis.
Now that you've attached a debugger, set up a listener, and established a stream of messages being passed into `traceSocketSend` and `traceSocketReceive`, it's quite straightforward to output the desired content into the console logs, either as strings or objects, for analysis or debugging purposes.
Enhancing WebSocket debugging through service worker integration
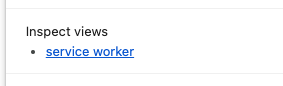
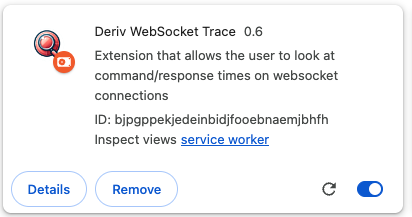
You can access the service worker console at any time by navigating to the extensions page or the details page of your extension. Simply click on the service worker link, and the console will appear, allowing you to view logs and debug in real time.
If you're developing and only need raw output data, that might be enough for your debugging or other uses. However, you can take it a step further by sending this data to the foreground, rendering it in a window, and significantly improving the presentation using React or your preferred UI framework.
Final steps in debugging the WebSocket connection
The service worker can't directly access the DOM, so you must communicate with the foreground content pages through listeners. This requires a bit of coordination to ensure there's a listener ready before you start sending messages. Otherwise, you could end up just sending messages into the void, leading to numerous console errors. Alternatively, you could implement a handshake mechanism to confirm when your content window is active and ready to receive messages.
Open a window:
let popupWindowId;
chrome.windows.create({
 'url': chrome.runtime.getURL("../html/content.html"),
 'type': 'popup', // or 'normal' for a standard window
 'width': 400,
 'height': 600
}).then((window) => {
 popupWindowId = window.id;
});
An example of JavaScript used in debugging.
The `content.js` script, which is loaded in `html/content.html`, initially sends a message to the service worker indicating that it is up and running:
chrome.runtime.sendMessage({ type: "CONTENT_SCRIPT_READY" });An example of JavaScript used in debugging.
In my service worker, I've set up listeners for both the extension pop-up window and the content window:
let contentWindowReady = false;
let popupWindowReady = false;
chrome.runtime.onMessage.addListener((request, sender, sendResponse) => {
 switch (request.type) {
   case "POPUP_SCRIPT_READY":
     popupWindowReady = true;
     break;
   case "CONTENT_SCRIPT_READY":
     contentWindowReady = true;
     break;
   default:
     console.log(`Unknown message type: ${request.type}`);
 }
});
Code for setting up listeners in JavaScript.
Once the content window has sent us a message, we can safely send messages to it from `traceSocketSend` and `traceSocketReceive` as outlined below:
if (contentWindowReady) {
  chrome.runtime.sendMessage({
    destination: "CONTENT",
    type: "MESSAGE_SENT",
    content: `SENT => command:${command}, req_id:${payload.req_id}`});
}
Sending messages in JavaScript.
The content of the sendMessage is entirely user-defined. Keep in mind that any listener set up in the extension will receive ALL messages sent. Therefore, specifying destinations and types enables you to establish your own messaging protocol.
chrome.runtime.onMessage.addListener(function(request, sender, sendResponse) {
 if (request.destination === 'CONTENT') {
   switch(request.type) {
     case "EXTENSION_INFO":
       document.getElementById('version-placeholder').textContent = request.version;
       document.getElementById('name-placeholder').textContent = request.name;
       break;
     case "MESSAGE_SENT":
       var newDiv = document.createElement("div");
       newDiv.id = "tableItemSent";
       newDiv.innerHTML = request.content;
       document.getElementById("table").appendChild(newDiv);
       break;
     case "MESSAGE_RECEIVED":
       var newDiv = document.createElement("div");
       newDiv.id = "tableItemReceived";
       newDiv.innerHTML = request.content;
       document.getElementById("table").appendChild(newDiv);
       break;
     default:
       console.log(`Unknown message type: ${request.type}`);
   }
 }
});
An example of specifying destinations in JavaScript.
Hopefully, this information proves useful and helps you get your WebSocket debugging Chrome extension up and running quickly with minimal fuss. The extension framework is very powerful and enables a wide range of functionalities.
About the author
Kate Wilkins is a principal engineer at Deriv with a lifelong love of continuous learning, not just technology, but everything from computer languages, frameworks, and fundamental technologies to sailing and construction.