Going beyond DORA metrics in DevOps performance assessment

Achieving peak performance is every software development team's aim, and at Deriv, we're no exception. To realise this ambition, understanding our current standing is crucial. Key DevOps metrics serve as a beacon, highlighting our strengths and areas for improvement.
The idea of using metrics, including those developed in the DevOps Research & Assessment programme (DORA metrics), to enhance team performance is straightforward in theory, but putting it into practice is often more complicated. While these metrics hold great promise, many development teams struggle to even track them or, when tracked, put them into effective use.
Apart from deciding which metrics to focus on, we had to devise effective methods to measure and visually represent them, and more importantly, we needed to ensure that all this good work would not go to waste.
In this blog post, we delve into the metrics we chose to focus on and the process we established to track them.
DORA metrics explained
DORA metrics, a cornerstone in the DevOps landscape, serve as foundational indicators of a development team's performance. These metrics include four key parameters: deployment frequency, lead time for changes, change failure rate, and time to restore service (also known as mean time to repair or MTTR).
- Deployment frequency measures how often code is deployed to production or released to end-users. It reflects a team's ability to implement and deliver new features, updates, or fixes.
- Lead time for changes gauges the amount of time it takes for a change — from commitment to deployment. Shorter lead times indicate a more agile and responsive development process.
- Change failure rate assesses the percentage of deployments that fail in production, necessitating immediate remediation. A lower rate is indicative of higher reliability in the deployment process.
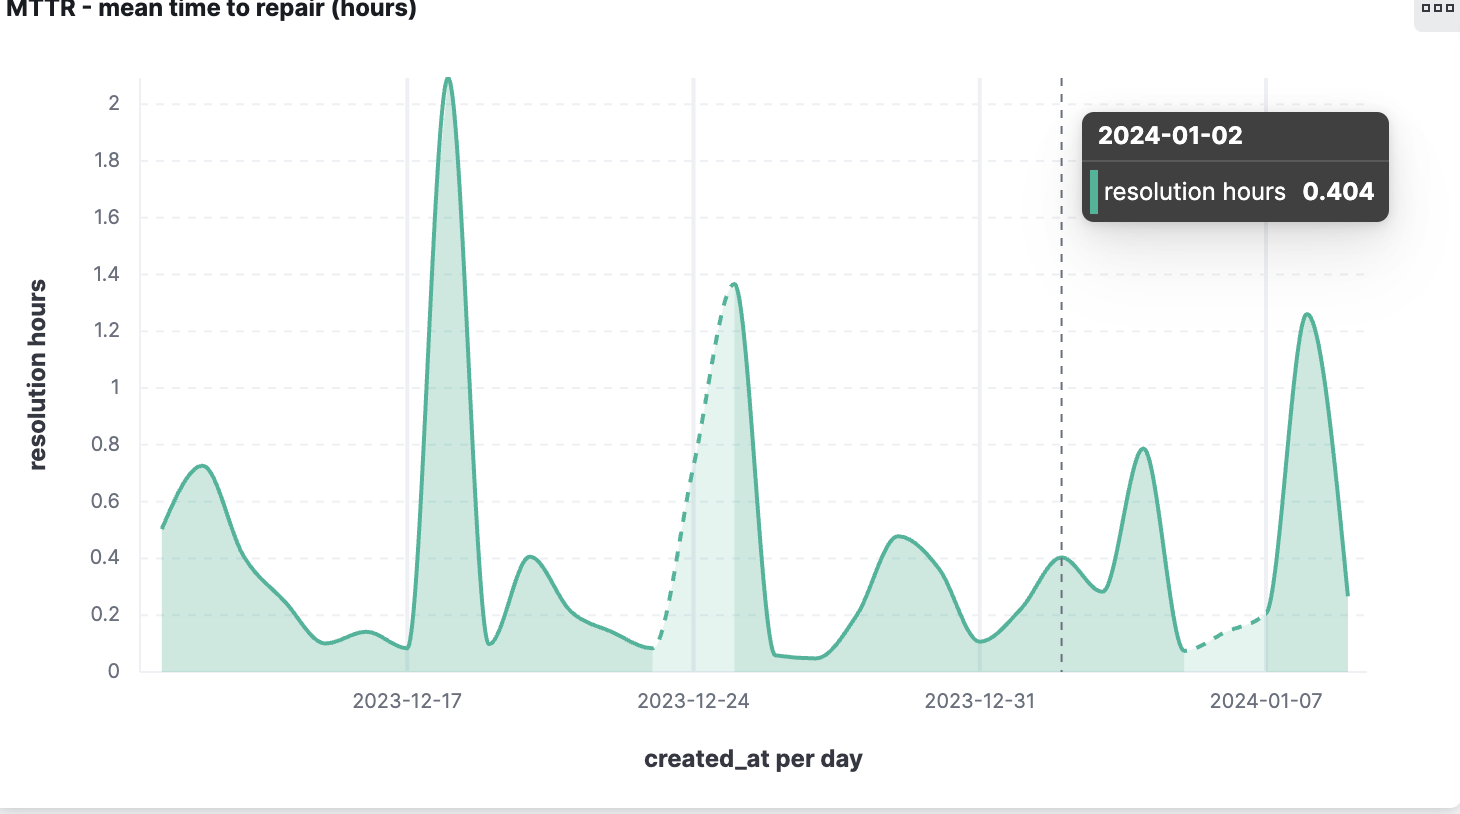
- Time to restore service measures the time taken to recover from a failure in the production environment. A shorter recovery time suggests a team's effectiveness in managing and resolving incidents.
While DORA metrics are invaluable, offering a high-level view of development efficiency and effectiveness, they are not exhaustive. They predominantly focus on the deployment and post-deployment phases, leaving out critical aspects of the development lifecycle.
Gaining broader insights from State of DevOps and LinearB reports
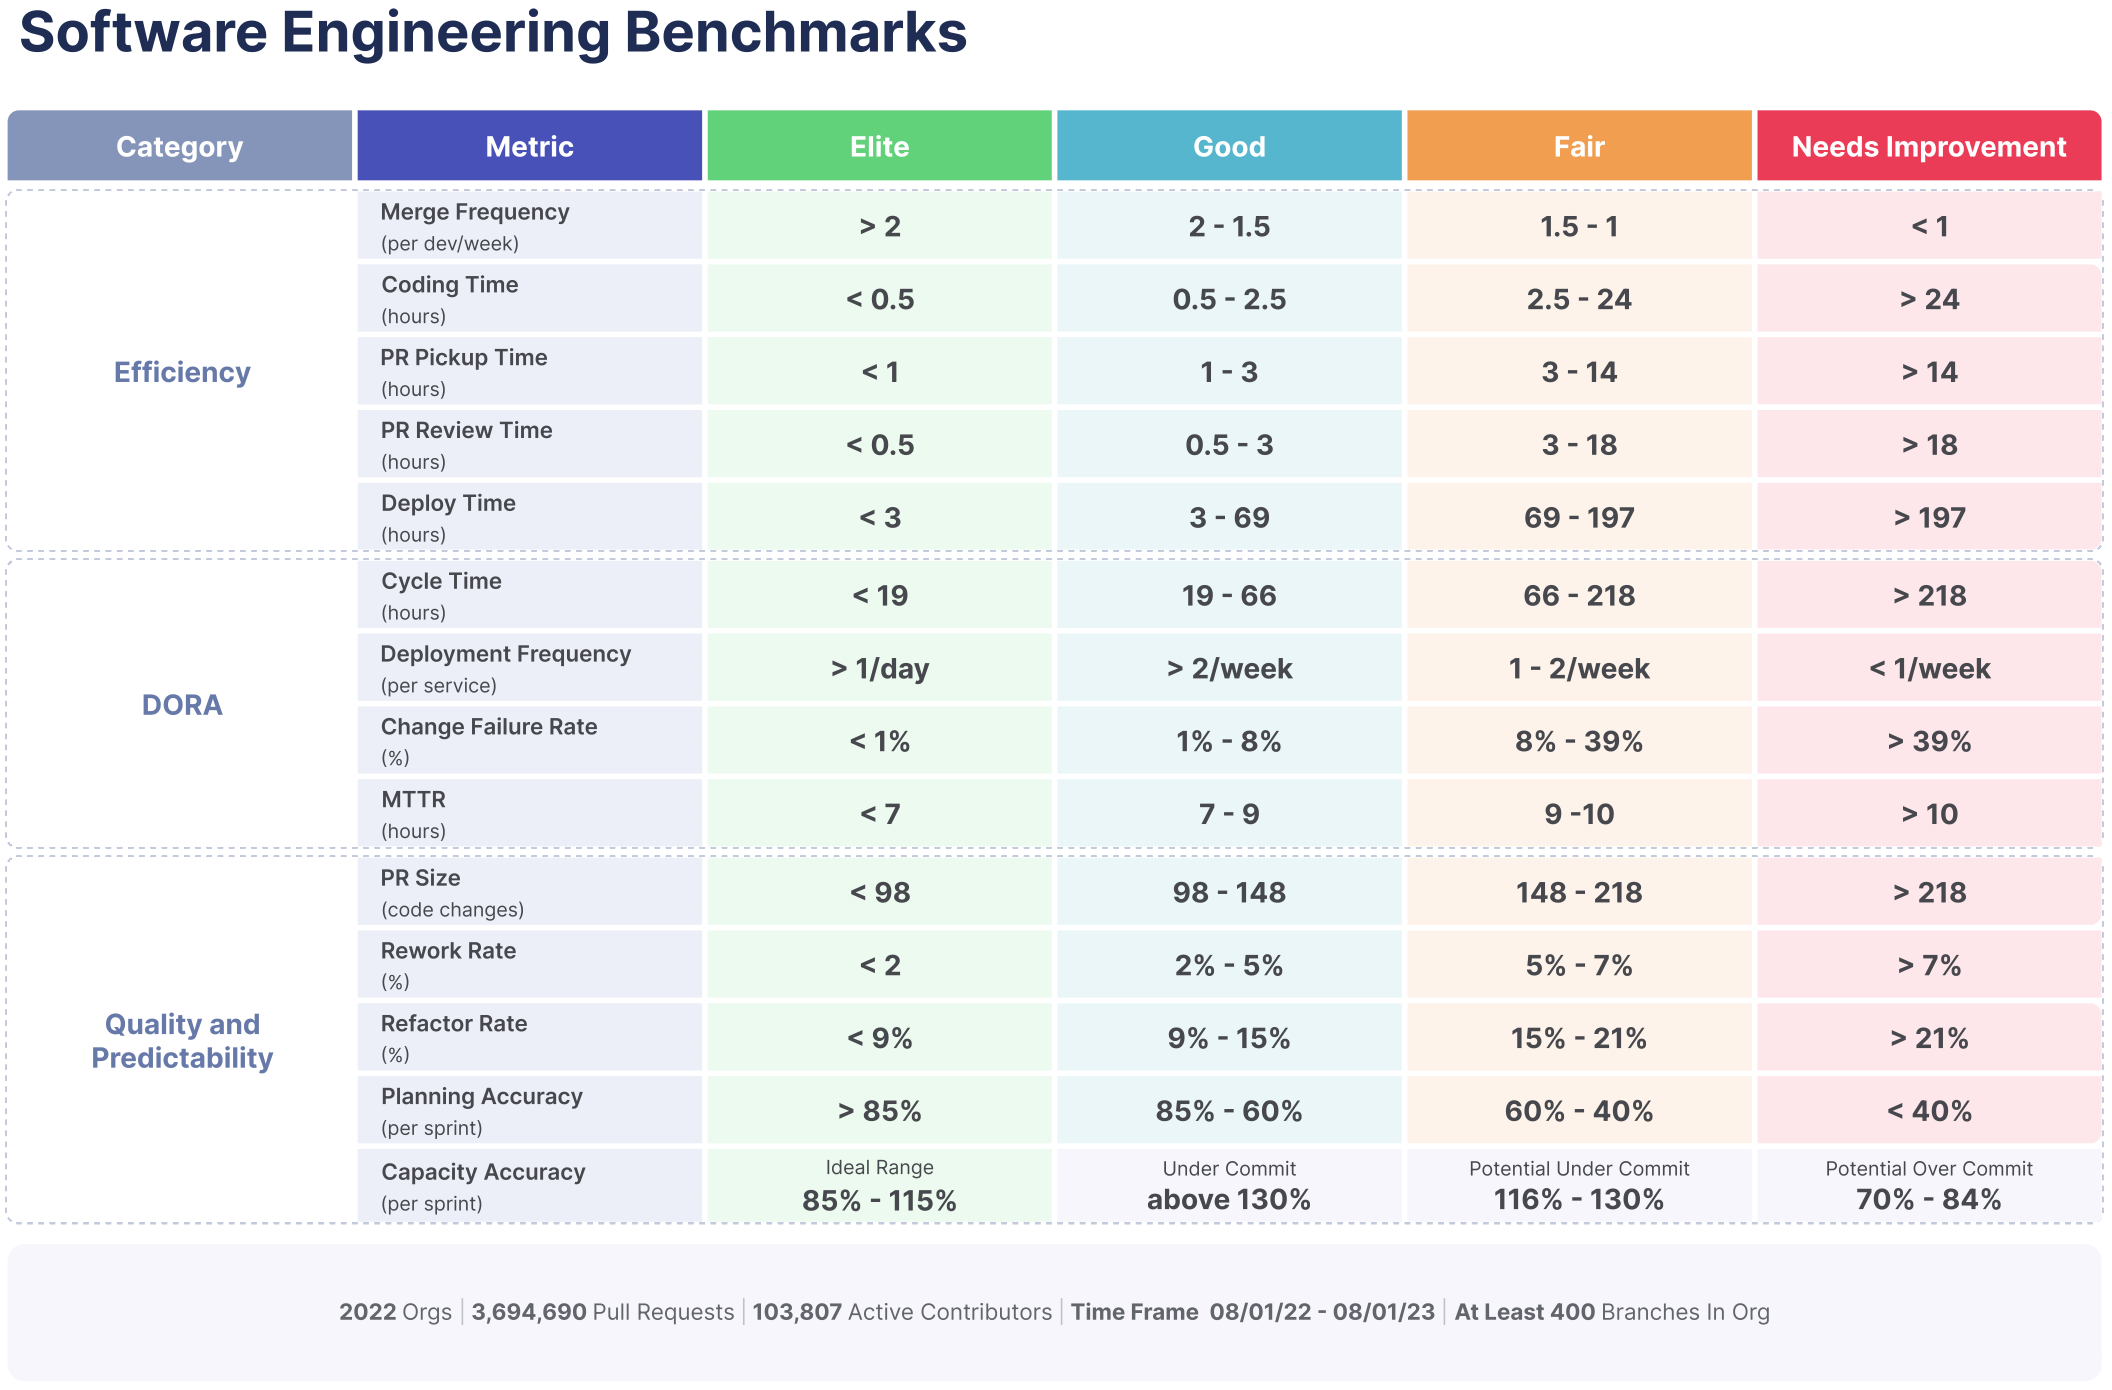
Recognising the need to broaden our perspective beyond DORA metrics, we turned to influential industry reports for deeper insights. The State of DevOps and LinearB reports have been pivotal in refining our approach to measuring DevOps efficiency.
The annual State of DevOps report offers an eye-opening analysis of the practices that set 'elite' DevOps teams apart, specifically highlighting their remarkable recovery times, deployment frequencies, and overall efficiency. It emphasises the importance of not just measuring outcomes (like deployment frequency and change failure rate) but also understanding the underlying processes that drive these outcomes, such as coding practices, PR reviews, and team collaboration.
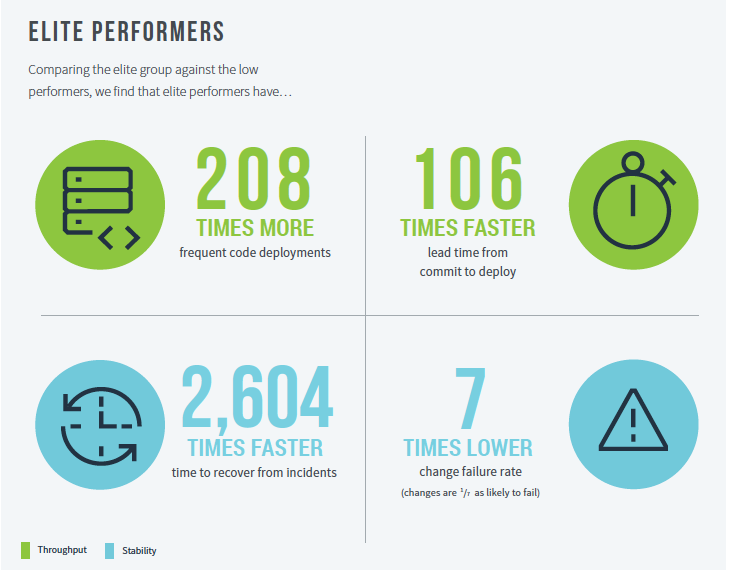
Perhaps unsurprisingly, the report highlights how streamlined PR reviews can significantly enhance productivity and code quality.
Going beyond DORA: Integrating additional DevOps metrics
Acknowledging the limitations of DORA metrics, we've expanded our metrics suite to include additional parameters that provide a more comprehensive view of our DevOps performance. These additional metrics include:
- Coding time: This measures the actual time spent writing and editing code. It helps us understand the productivity and efficiency of our developers in the coding phase.
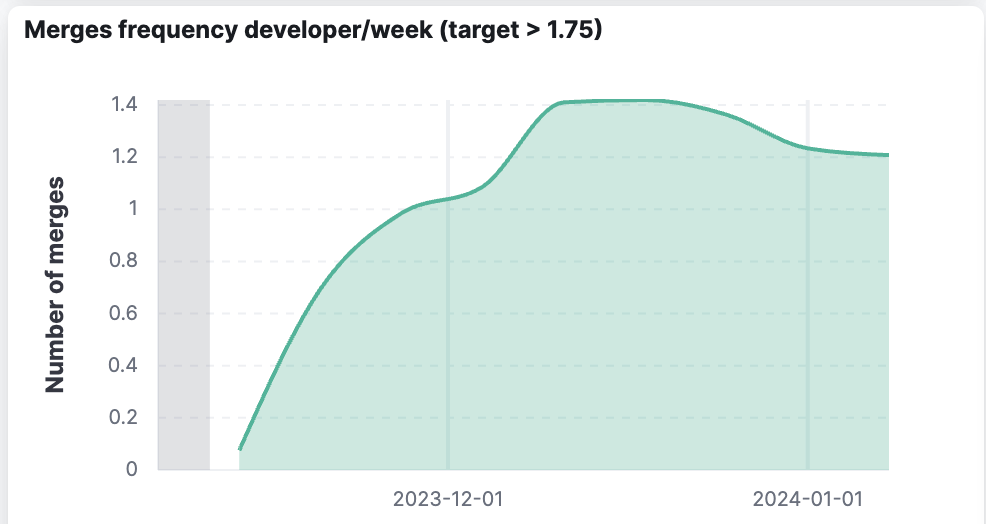
- Merge frequency: By tracking how often code is merged into the main branch, we gauge the flow of code through the development pipeline and identify potential bottlenecks.
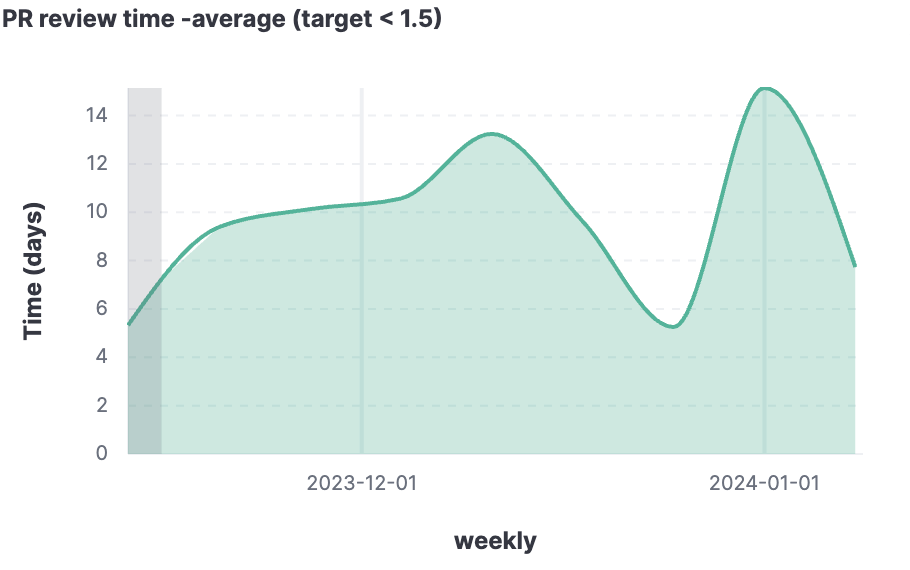
- PR (pull request) review time: This metric indicates the time taken to review and approve pull requests. Efficient PR review processes are crucial for maintaining code quality and ensuring timely feature integration.
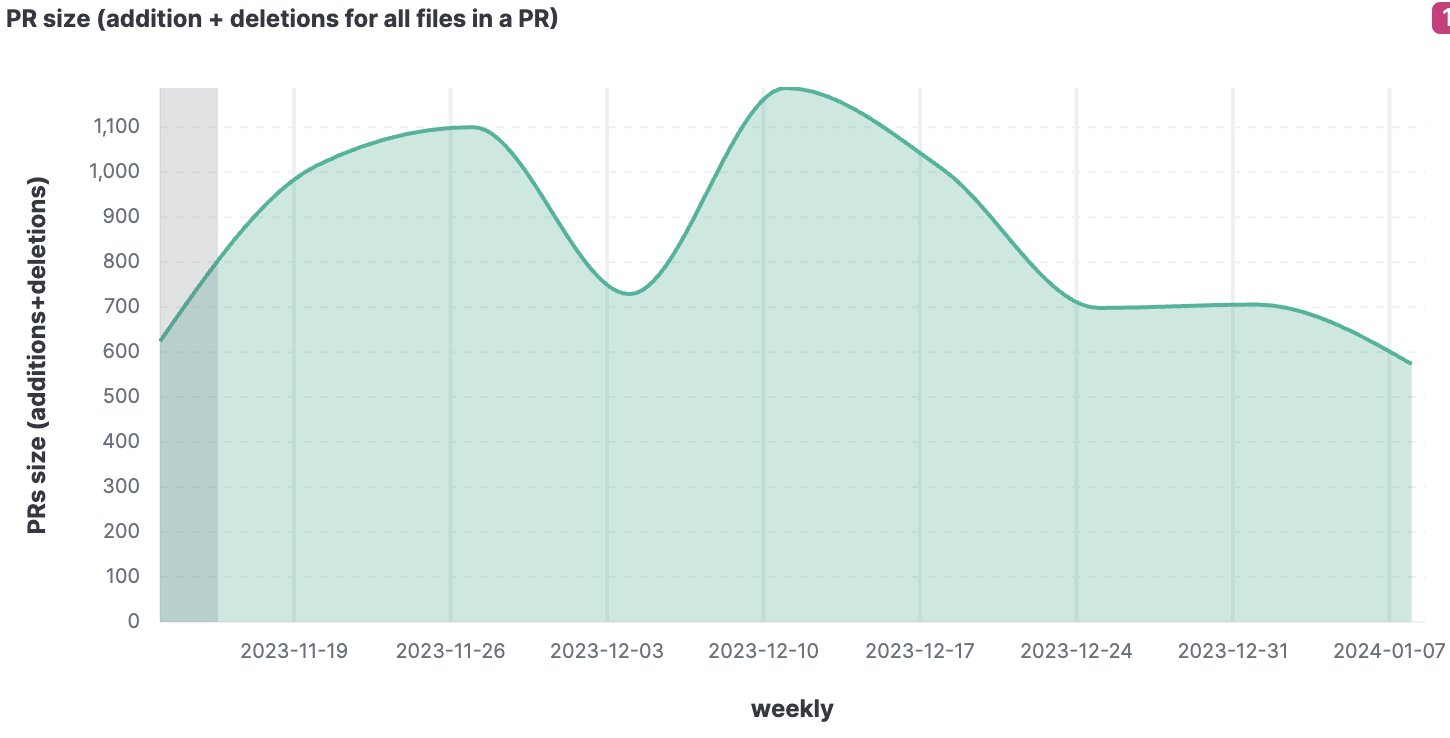
- PR size: Monitoring the size of pull requests helps in assessing the complexity and manageability of code changes. Smaller, more frequent PRs are generally preferred for smoother, more manageable integration and review processes.
By incorporating these metrics into our performance measurement framework, we aim to attain an understanding of our entire development process. This approach enables us to identify and address inefficiencies not just in the deployment and post-deployment stages but throughout the entire software development lifecycle.
Tracking Deriv’s DevOps metrics with tools and custom solutions
Our methodology for gathering and analysing DevOps metrics is a blend of open-source solutions and proprietary software.
A vital element in our toolkit is Monocle, an open-source tool primarily used for collecting GitHub statistics. Monocle is adept at storing GitHub data in an Elasticsearch database, offering a user-friendly web front-end named Kibana for effective data visualisation.
To maximise the potential of the data stored in Elasticsearch, we've turned to Kibana to visualise our reports. Kibana’s powerful data visualisation capabilities grant us significant flexibility, enabling us to tailor the presentation of our data precisely to our requirements. This strategic choice allows us to not just access the data, but to interpret it in ways most conducive to our analytical needs.
Technical implementation
Despite its strengths, Monocle lacks the capability to cover deployment-related information. To address this, we’ve developed a bespoke service that complements Monocle's functionality. This customised service is designed to gather deployment data directly from GitHub, seamlessly integrating it into our Elasticsearch store, thus ensuring a holistic view of our development lifecycle.
Calculating lead time metrics presented a unique challenge, as doing so directly using only Elasticsearch queries proved to be complex. To overcome this challenge, we enhanced our service to compute this metric more effectively. It queries Elasticsearch for pertinent pull requests and commits data, thereby simplifying and refining the calculation process.
Furthermore, we incorporated the PagerDuty API to acquire incident-related data. This integration is crucial for visualising MTTR, an essential aspect of our performance evaluation. The PagerDuty API provides us with detailed incident data, enabling us to measure and analyse our response and resolution times effectively.
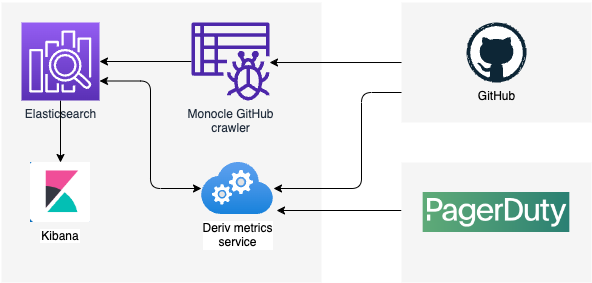
This composite approach – combining Monocle, Kibana, our custom solutions, and the PagerDuty API – proved to be a reasonable solution to give us a rounded view of our operational metrics. A big thank you to the Monocle support team for their exceptional assistance in the development of a customised dashboard that meets our specific requirements. Their prompt and efficient response to our bug reports has also been invaluable.
Tracking progress and refining DevOps practices
Since the initiation of our enhanced metrics tracking in 2023, by closely monitoring and optimising our PR review times, we've achieved a more streamlined code integration process, leading to a noticeable reduction in deployment delays and conflicts. Similarly, the detailed analysis of coding time metrics has enabled us to identify and address productivity bottlenecks, resulting in a more efficient use of developer time and resources.
These continuous improvements in our metric tracking and analysis are not just about numbers; they reflect a deeper shift in our development culture towards proactive problem-solving and efficiency optimisation. As we further refine these processes, we anticipate even greater strides in our development efficiency and overall product quality.
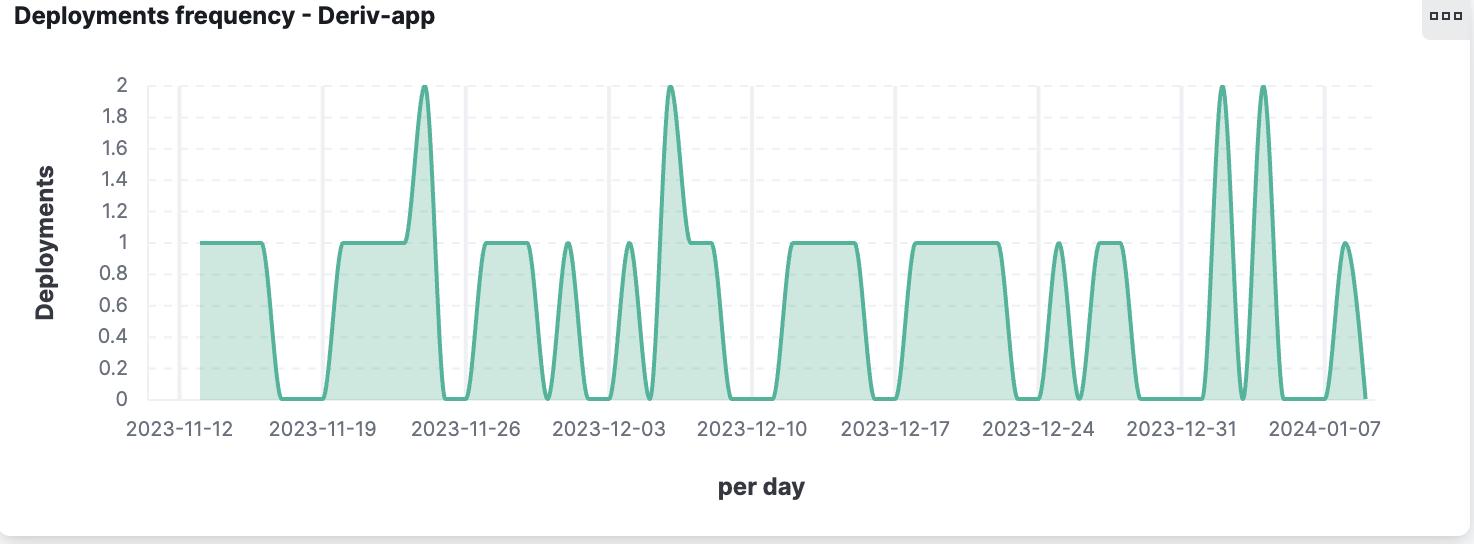
Below are some example Kibana charts.
Fostering a data-driven culture in tech teams
We are committed to fostering a data-driven culture among our global team of over 300 developers. By integrating these metrics into our daily operations, our teams should feel more empowered to proactively identify and resolve efficiency bottlenecks. This approach not only enhances our productivity but also cultivates a sense of ownership and accountability within our teams.
We invite you to join us in this ambitious journey towards setting new benchmarks in DevOps efficiency and performance. Explore our career opportunities and aspire to be elite.
About the author
Leonid Sokolovskiy, a tech enthusiast and a believer in continuous improvement, is our VP of Engineering at Deriv’s Reading Office, UK, responsible for our Developer Experience initiatives.